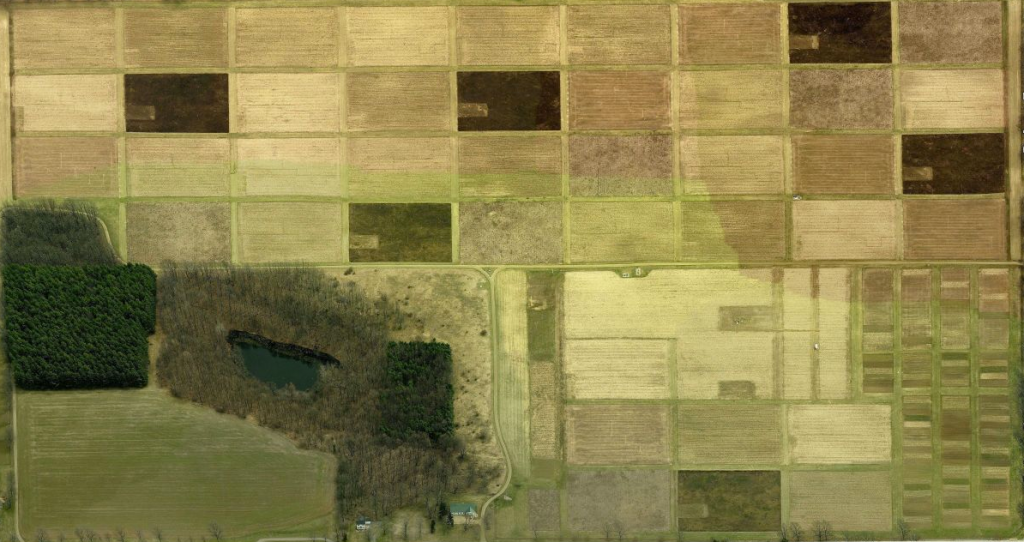
KBS scientists maintain 4 different types of successional plots: two get tilled every year and two have been undisturbed since 1988. One of the tilled and one of the untilled plot get fertilized with nitrogen, an important nutrient limiting plant growth, every year; the other two plots do not. Each year, scientists collect data on which plant species are there, how much they grow, and other characteristics of the plants. In this lesson, students will explore this data to learn about succession, human disturbance (tillage), plant traits, plant life history, and population growth. They will also gain scientific skills in graphing and math.
At the conclusion of the lesson, students will be able to:
- Work with a real data set from the KBS LTER
- Understand how management regimes can influence communities
- Have a good understanding of using Microsoft Excel to analyze data
Resources:
- Lesson plan (.doc)
- Introduction(.pdf)
- Datasets(.xls)
- Student worksheet (.doc)
Lesson plan created by GK-12 fellows Emily Grman and Kane Keller, 2009

