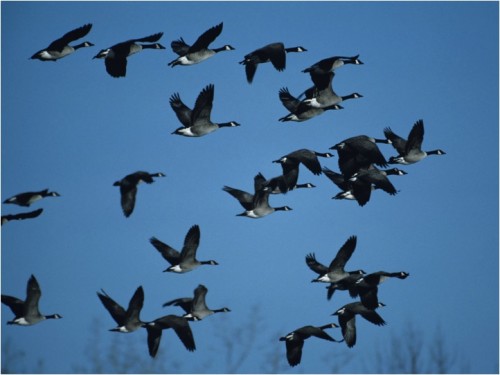
The timing of recurring life cycle events for plants and animals, like flowering and migration, are largely determined by cues organisms take from the climate. Scientists who study phenology, or the timing of these natural events, are interested in how climate change, particularly rising global temperatures and unpredictable transitions between seasons, will influence the timing of phenological events. For example, what can we expect to happen to the migration timing of birds, the mating season for animals, or the flowering times in plants? Further, how might abiotic seasonal changes like melt dates for lakes and rivers respond to climate change? To answer these questions, scientists turn to long-term datasets to examine whether shifts in phenological events are occurring over extended periods of time.
Long-term datasets are extremely useful because scientists can examine average trends in timing shifts over periods of decades and often in different regions. Citizen science has played a major role in curating many of these datasets. Citizen science is essentially research conducted by “crowdsourcing” – individuals collect data and contribute to a large dataset that can then be analyzed to address scientific questions. Phenology data is easy to collect and involves observations that we make every day, but hardly ever record. Technology makes it extremely easy to record, aggregate, and store citizen science data online for future use.
In this lesson we will use a few of these datasets to go through the scientific process of forming and testing hypotheses using real data. Students will be able to examine changes in phenology over 30+ year timespans, and address the scientific question, “Do we see evidence for climate change in the phenology of plants and animals?” We will also discuss how students as a class can start curating their own long-term phenological datasets by observing organisms in your schoolyard or BEST Plots!
At the conclusion of the lesson, students will be able to:
- Define phenology and give examples in plants and animals
- Graph phenology data
- Interpret results from a graph
- Make claims about organismal responses to climate change
- Identify locations where they can submit citizen science data they collect
Resources:
- Lesson Plan
- Phenology and Climate Change PowerPoint
- Student Worksheet
- Climate Basics Article
- Springing Forward Article
- NY Times Article on eBird
Lesson plan written and created by GK-12 Fellows Liz Schultheis and Dustin Kincaid, 2012

