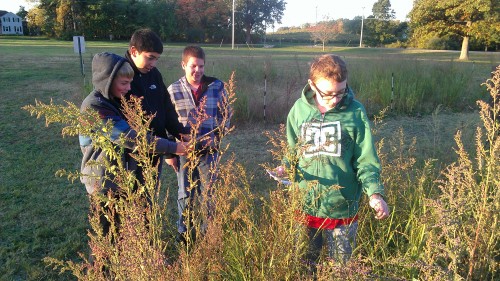
The BEST plots are an excellent system for introducing more opportunities for scientific inquiry into the classroom. While there are many teaching opportunities that arise from simply carrying out the data collection that allows us to address our broad questions (can we maximize productivity while still maintaining biodiversity?), students should ideally also be using the plots to develop research questions and experiments of their own. This lesson and the accompanying worksheet provide a useful tool for helping students and teachers (who may not have much previous experience) identify interesting questions and develop hypotheses using the BEST plots. This lesson also allows students to practice the steps of the scientific method prior to physically carrying out an experiment and can easily be used even if students can’t access a BEST plot.
At the conclusion of the lesson, students will be able to:
- Place their work on the plots in the context of the larger project
- Identify additional questions about the plots
- Develop new questions and hypotheses
- Identify the data needed to address a specific scientific question
Resources:
Lesson Plan created by GK-12 Fellows Cara Krieg, Sara Garnett, Dustin Kincaid, and Jake Nalley, 2013

