May 152014
 

pooptrain

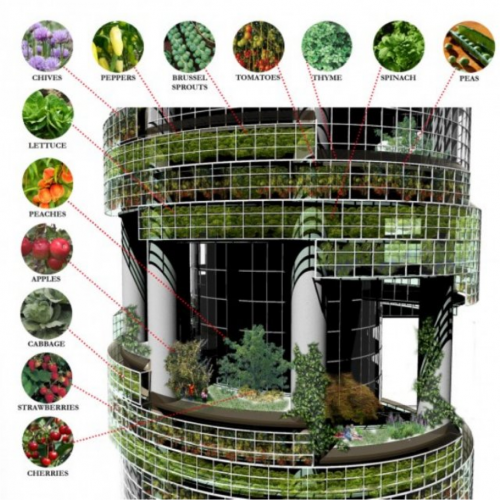
There has been a significant shift in human populations toward urban areas, which in conjunction with the growing global population has increased the demand for resources like food and energy. In order to satisfy these demands, we must find ways to produce food and energy more sustainably and increase our energy efficiency. Some of the ways we try to accomplish these goals involve taking inspiration from biological systems. This two-part lesson will outline many of the ways that we have applied what we know about nature to make urban systems more sustainable, build in ways that reduce energy demand or increase efficiency, and manage our waste more effectively.

At the conclusion of the lesson, students will be able to:

  • Explain why there is an increasing demand for resources in urban areas
  • Explain biologically-inspired strategies for providing food sustainably
  • Explain how biologically-inspired design can increase energy efficiency and reduce costs

Resources:

Update 11/20/14 – check out this article about a new bus in the UK running on human waste!

Lesson Plan created by GK-12 Fellows Jakob Nalley and Sara Garnett, 2014

Aug 092013
 

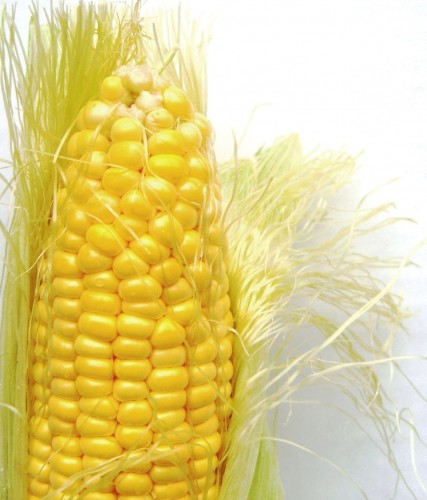
Corn_on_the_cob

Photo Credit: Darwin Bell

Corn and soybeans cover 6% of the total land area in the United States and are grown on 15 times as much land as all fruits and vegetables combined.In this activity, students will take a walk out into a corn field to become more acquainted with this crop that is so common.Students will make calculations for the number of plants and ears of corn per acre and then estimate the total number of ears grown in the U.S.in 2002 based on USDA data.Students will be informed about the different types of corn available and that most of it is actually used for products other than human food. Finally, corn is a crop that requires high amounts of energy and nutrients to grow successfully, making it a crop that can potentially contribute to environmental pollution if managed poorly.

At the conclusion of this lesson, students will be able to:

  • Identify corn and soybeans as the major crops grown in the United States
  • Conduct an investigation on a local scale to make predictions at a larger scale
  • Identify corn plants as having only one ear per plant
  • Estimate the number of ears of corn grown in the US in a given year
  • Estimate the number of ears of corn per plant
  • Understand that almost all of the corn grown in the US is not eaten by humans, but is fed to animals or converted to useable products
  • Identify corn as a highly productive crop, but also one that requires a lot of energy to grow

Resources:

Lesson Plan

Lesson created by Brook Wilke

Jan 212013
 

pic2This lesson will explore how plant traits like seed dispersal (e.g., wind-dispersed, animal-dispersed, etc.), seed hardiness, and land-use history influence the assembly of weed communities following a major disturbance (e.g., construction of a BEST plot, agricultural field, or garden plot). The focus will be on volunteer species (read: weeds) most commonly found in the BEST plots across the network. The lesson begins by providing students background information on seed traits and land use legacies. After covering this information, participants will do a brief activity that involves making predictions about which plant traits make weeds made most successful. Students will spend the remaining portion of the lesson analyzing and interpreting volunteer species abundance data from the BEST plot network.

At the conclusion of the lesson, students will be able to:

  • List and describe four different plant dispersal mechanisms
  • Describe three determinants of “how a plant got there” (dispersal mechanism, seed bank longevity, effect of landscape)
  • Better interpret histograms and scatterplots

Resources:

Lesson Plan created by GK-12 Fellows Tyler Bassett, Dustin Kincaid, and Cara Krieg, 2012


Nov 072012
 

In this lesson, students learn about the difference between climate and weather and how we expect Michigan’s climate to change.  They use real data from the Kellogg Biological Station’s agricultural Long Term Ecological Research site to predict how specific crops may respond to climate change.

At the conclusion of the lesson, students will be able to:

  • Explain the difference between climate and weather
  • Name three ways the Michigan climate is expected to change
  • Show how some crops may improve with climate change while others decline

Resources:

Lesson written and created by GK-12 fellows Tomomi Suwa and Anne Royer, 2012