
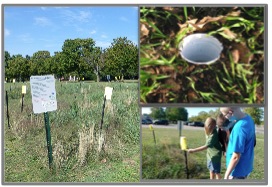
 In the following lessons, we use questions generated for and data collected from the BEST (BioEnergy SusTainability) plots to have students make predictions, draw graphs, interpret data patterns, and support claims with evidence. Students play a fun and engaging game that helps them think about the biology involved in how plants grow or how invertebrates find food in their environment. The outcomes of the game help students make predictions. We also have four classroom activities, based on the Data Nugget model, that get students looking at real data, making graphs, and answering questions by making evidence based claims. These lessons focus on parts of the overarching scientific question for the BEST plots: “Can we grow our fuel and save our flowers and butterflies, too?”
 These lesson plans address the following questions:
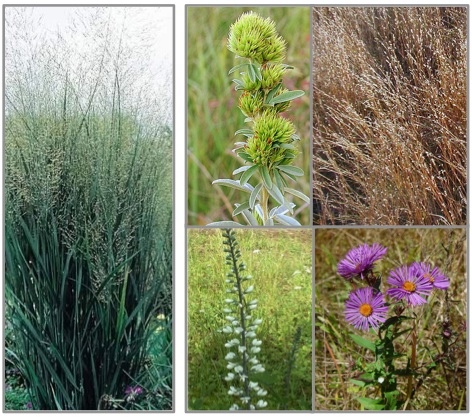
- How do the kinds of plants we planted (switchgrass and prairie) affect how much plants grow (measured as biomass)?
- How does soil moisture affects biomass?
- How does biomass affect the diversity of invertebrates?
- How does the diversity of plants affect the diversity of invertebrates?
At the conclusion of the lesson, students will be able to:
- Make predictions about outcomes of scientific experiments
- Describe patterns in data and relationships between variables
- Create graphs
- Interpret graphical data
- Use data as evidence to support claims
Length of Lesson: Two 45- to 60-min class periods, or more
- One class period to discuss scientific question and game to generate predictions
- 0.5-1 to complete the graph and data interpretation
- Each additional activity will take 0.5-1 class period
Resources:
- Lesson plan
- Powerpoint (.pdf)
- Condensed original data from the BEST plots (.xlsb)
Activities:
- How can we grow our fuel with plants?
- Does soil moisture affect plant performance?
- Does plant biomass promote more invertebrate diversity?
- Does plant diversity promote more invertebrate diversity?
These activities were created based on the Data Nuggets model, developed in 2011 by MSU fellows in the K-12 Partnership. To access Data Nuggets on a variety of topics, follow this link! BEST Plot lesson plan and activities written by GK-12 Fellows Cara Krieg, Alycia Lackey and Tomomi Suwa, 2013.