Sarah Bodbyl

Nov 072012
 

This lesson takes a look at some of the ways that climate change may directly affect the life of a Michigander. It includes several opportunities for discussion about student’s observations and their connection to data. Using an internet-based weather forecasting tool for Michigan, students will complete an activity that allows them to visualize how several climatic changes will affect their lives.

At the conclusion of the lesson, students will be able to:

  • Describe three different climatic changes that scientists are predicting for Michigan
  • Provide examples of how those changes will affect their and their families day-to-day lives
  • Draw conclusions based on maps and simplified data
  • (For more advanced students) Use internet tools and data to make predictions about additional climate scenarios

Resources:

Lesson written and created by GK-12 fellows Tyler Bassett, Sara Garnett, and Cara Krieg, 2012

Nov 062012
 

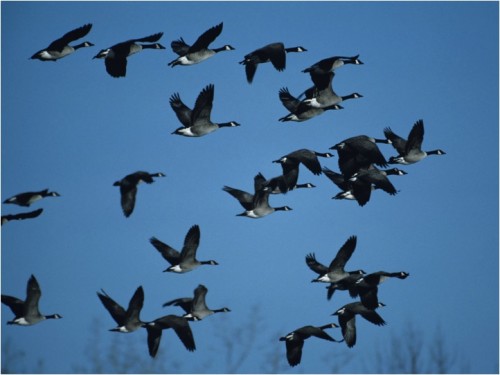
The timing of recurring life cycle events for plants and animals, like flowering and migration, are largely determined by cues organisms take from the climate. Scientists who study phenology, or the timing of these natural events, are interested in how climate change, particularly rising global temperatures and unpredictable transitions between seasons, will influence the timing of phenological events. For example, what can we expect to happen to the migration timing of birds, the mating season for animals, or the flowering times in plants? Further, how might abiotic seasonal changes like melt dates for lakes and rivers respond to climate change? To answer these questions, scientists turn to long-term datasets to examine whether shifts in phenological events are occurring over extended periods of time.

Long-term datasets are extremely useful because scientists can examine average trends in timing shifts over periods of decades and often in different regions. Citizen science has played a major role in curating many of these datasets. Citizen science is essentially research conducted by “crowdsourcing” – individuals collect data and contribute to a large dataset that can then be analyzed to address scientific questions. Phenology data is easy to collect and involves observations that we make every day, but hardly ever record. Technology makes it extremely easy to record, aggregate, and store citizen science data online for future use.

In this lesson we will use a few of these datasets to go through the scientific process of forming and testing hypotheses using real data. Students will be able to examine changes in phenology over 30+ year timespans, and address the scientific question, “Do we see evidence for climate change in the phenology of plants and animals?” We will also discuss how students as a class can start curating their own long-term phenological datasets by observing organisms in your schoolyard or BEST Plots!

At the conclusion of the lesson, students will be able to:

  • Define phenology and give examples in plants and animals
  • Graph phenology data
  • Interpret results from a graph
  • Make claims about organismal responses to climate change
  • Identify locations where they can submit citizen science data they collect

Resources:

 Lesson plan written and created by GK-12 Fellows Liz Schultheis and Dustin Kincaid, 2012

Nov 062012
 

While public policy on climate change continues to be debated in local and national governments, the effects of global warming are already being felt by many different plant and animal populations. Rising temperatures can directly impact plant and animal populations by causing range shifts as species are forced to move into areas with temperatures they can tolerate.  In the process of shifting home ranges different species that were previously isolated from one another may come in contact, leading to new biotic interactions (whether they be predator-prey, host-parasite, or resource competitor interactions).

In this lesson, students will be introduced to the basics of climate change research. Specifically, focusing on the impact climate change will have on the plant and animal populations.  We will investigate a number of specific aspects that will be directly impacted through climatic changes, with a number of real world examples. The lesson is broke into three main portions, a brief introductory presentation, an interactive, outdoor game, and a worksheet developed to engage students with real scientific graphs and data.

At the conclusion of the lesson, students will be able to:

  • Link human actions with changes taking place on Earth
  • Explain how rising temperatures are influencing animal/plant populations
  • Describe specific examples where climate change may be either detrimental or beneficial
  • Gain experience interpreting graphs and making conclusions
  • Get excited about role-playing as an animal

Resources:

Lesson plan written and created by GK-12 Fellows Jake Nalley and Michael Kuczynski, 2012

Oct 282012
 

by Michael Kuczynski, October 2012

This fall, Mrs. High’s highschool students at Delton Kellogg had the opportunity to get outside and do a little research on the bioenergy plots.  Different classes focused on collecting different sets of data, all building towards an answer to the question “Can we grow grass or flowers for our fuel and save the butterflies too?”  In the morning students were clipping samples of biomass from the plots to investigate how we can maximize biofuel production while using the least amount of land.  Everything went very smoothly and the most challenging part for the students seemed to be keeping warm while working.

In the afternoon we set up pitfall traps and sticky traps to catch invertebrates in the plots.  We quickly realized that the rocks in the soil was making it a bit difficult to dig the holes for the pitfall traps and Mrs. High had to bring out some more heavy-duty shovels to get the job done.  Despite this hiccup the students had a fun time and seemed to really appreciate the opportunity to get outside.

A week later we collected our traps to see what invertebrates we had captured.   It was a little bit challenging at first trying to identify some of the insects that had been squashed on the sticky trap and there was certainly some squeamishness towards the bugs that had been sitting in soapy water in the pitfall traps for an entire week, but with a little patience we managed to muddle through and we had a lot of fun.  After all, science isn’t always nice and neat chemicals sitting on a lab bench…sometimes you have to get a little dirty!

Oct 252012
 

October 2012, by Cara Krieg

The students of Harper Creek have been learning about biodiversity!  Mrs. Joostberns’ 4th graders ventured out one chilly morning to uncover the treasures waiting for them in the invertebrate traps that were set out the week before.  The students discovered that many fliesand bees stuck to the sticky traps placed above the plants.  In contrast, cups buried in the ground caught many worms, ants, and beetles.  Because of the heavy rains the weekend before, many of the cups flooded and some of the insects were still alive!  A giant grasshopper became the star of the show before I returned it safely to its home in the BEST plots.  The students were excited to see invertebrates in all different shapes and sizes.

The data collected that morning will be combined with the same measurements already taken at Harper Creek High School and Sonoma Elementary to figure out how our experimental treatments impacted the invertebrates.  The students at all three schools noticed that they caught more insects in the plots that were fertilized compared to the unfertilized plots.  Does fertilizing plants make more food for insects?  We’re excited to the see the data from the other BEST plots to answer this, and many other, interesting questions!

Oct 122012
 

October 2012, by Anne Royer

Marcia Angle’s 8th-graders at Lawton adventured out into the fall weather to explore the plants and animals living in their BESTplots.  We started with insect biodiversity.  After learning how to randomize the location of our traps, we sacrificed two dice to the prairie gods and left the traps out for a week.  Our sacrifice was acceptable, and we were rewarded with an abundance of insects and one rotten smelly mole.  Being a good fellow, I threw the mole back in the plot it came from, and we took some dead-mole-smelling insects back into the classroom to identify and count.  (Most of the insects just smelled like dead bugs, i.e. roses.)  We had a great time discovering what we’d caught.

A few days later the same students braved a frosty morning with plant identification booklets in hand, and even managed to not lose any dice.  These biodiversity data will be combined with biomass and soil data collected by Holly Visich’s high school students.  All of the students have been working with forming hypotheses and predictions using the BEST plot variables, so we’re looking forward to exploring some of these questions as the data comes in this fall.


Oct 022012
 

October 2012, by Jake Nalley

Landscape protocol at OlivetUsing the water level at OlivetThe eighth graders in Mr. Stolberg’s Earth Science class at OlivetMiddle School wereabletospend some well-deserved time outside as they were introducedto the BEST plots. To gain a better understanding of how the surrounding lands can influence the plots the students ran the small-scale landscape protocol. Students wereseparated into two groups, Team Landscape and Team Elevation. Team Landscape identified how the land was being used for the fifty meters surrounding each side of the plots. Team Elevation got to learn how touse a water level, and also determine the slope of theland surrounding the plots. Through the hard work of all the 8th graders, we were able to determine that the land surrounding the plot is primarily unmanaged, naturally occurring field, except for the parkinglot that is twenty meters to the south of the plots. Also, both plots are situated on relatively level land. As the students pointed out, the benefit of level land is it will help minimize the influence from the surrounding land, such as the parking lot, on the plots.

We are planning on growing some algae cultures, including a bioluminescent species, to address some basic biological questions.  How will a decrease in light exposure influence the intensity of luminescence? How can a changing growing temperature change the growth and luminescence? We have a lot of great work ahead of us, and I think the students are just as excited as I am!

Sep 242012
 

Sept 2012, by Tomomi Suwa

The sixth graders from the Gull Lake Middle School took advantage of this beautiful fall weather and spent some time outdoors at the BEST plots. To learn about differences in invertebrate diversity in different habitats, students set up two types of traps (sticky traps and pitfall traps) in the BEST plots, right outside their building. One week later, they collected the traps and tried to identify and count the invertebrates they found. In the sticky traps, they caught many types of flies and wasps and even grasshoppers and ladybugs. In the pitfall traps, they found spiders, beetles, and other types of crawling invertebrate species. Some students were a little scared to watch the dead creatures at first, but most of them got really excited to find so many different kinds of invertebrates in the trap.

We plan to continue to spending time outdoors as much as we can at the BEST plots and collect data on plant diversity and productivity as well as soil texture and chemistry. I look forward to working with the energetic and enthusiastic middle school students at Gull Lake middle school!

Sep 192012
 

Hi, my name is Sarah Bodbyl Roels. You may remember me from the 2012 Summer Institute, when I gave an invited plenary talk about my doctoral research at the University of Kansas. I have been hired by KBS as the new GK-12 program coordinator and I am currently working alongside Robin Tinghitella as she transitions to her new faculty position at the University of Denver in Colorado. Please congratulate Robin on her new job and thank her for many years of hard work developing the KBS GK-12 program.

About me: I am a native Michigander, growing up in Cutlerville, just south of Grand Rapids. I majored in biology at Calvin College and then moved to Kansas to pursue a doctorate in Ecology and Evolutionary Biology. I am a self-professed biology nerd and I love science! I am broadly interested in the evolutionary significance of the diverse reproductive strategies found among all plant and animal taxa. My doctoral research focused primarily on mating system evolution (or changes in the reproductive strategies of populations over time) in Mimulus, a genus of common North American wildflowers. I plan to continue research in the field of evolutionary biology in partnership with KBS and MSU. Stay tuned for updates and hopefully some new data nuggets.

Thoughts on GK-12: I had the distinct pleasure of being a GK-12 fellow at the University of Kansas from 2011-2012. I partnered with a 7th grade physics class in an inner city middle school. The GK-12 experience launched me into the world of science education and science communication, where I developed a deep conviction to improve science literacy and improved my ability to communicate clearly as a scientist.

I am excited by this new opportunity to continue growing relationships between the graduate students, faculty, and staff of KBS and the teachers, administrators, and students of the GK-12 partner districts. I look forward to meeting you all this year. Please feel free to contact me at bodbyl@msu.edu

~ Sarah