May 152014
 

pooptrain

There has been a significant shift in human populations toward urban areas, which in conjunction with the growing global population has increased the demand for resources like food and energy. In order to satisfy these demands, we must find ways to produce food and energy more sustainably and increase our energy efficiency. Some of the ways we try to accomplish these goals involve taking inspiration from biological systems. This two-part lesson will outline many of the ways that we have applied what we know about nature to make urban systems more sustainable, build in ways that reduce energy demand or increase efficiency, and manage our waste more effectively.

At the conclusion of the lesson, students will be able to:

  • Explain why there is an increasing demand for resources in urban areas
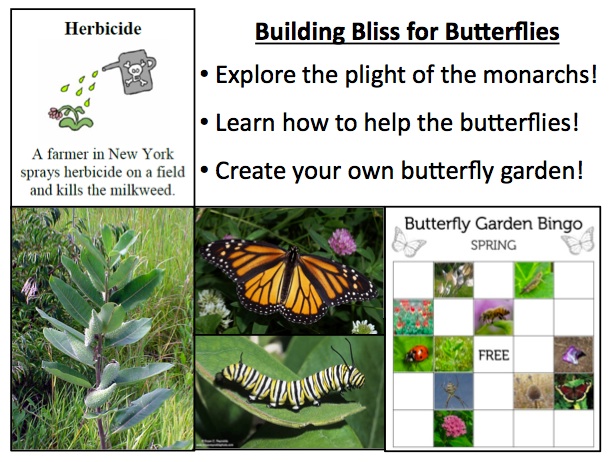
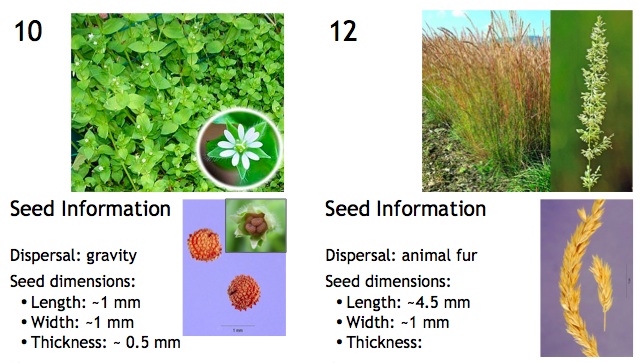
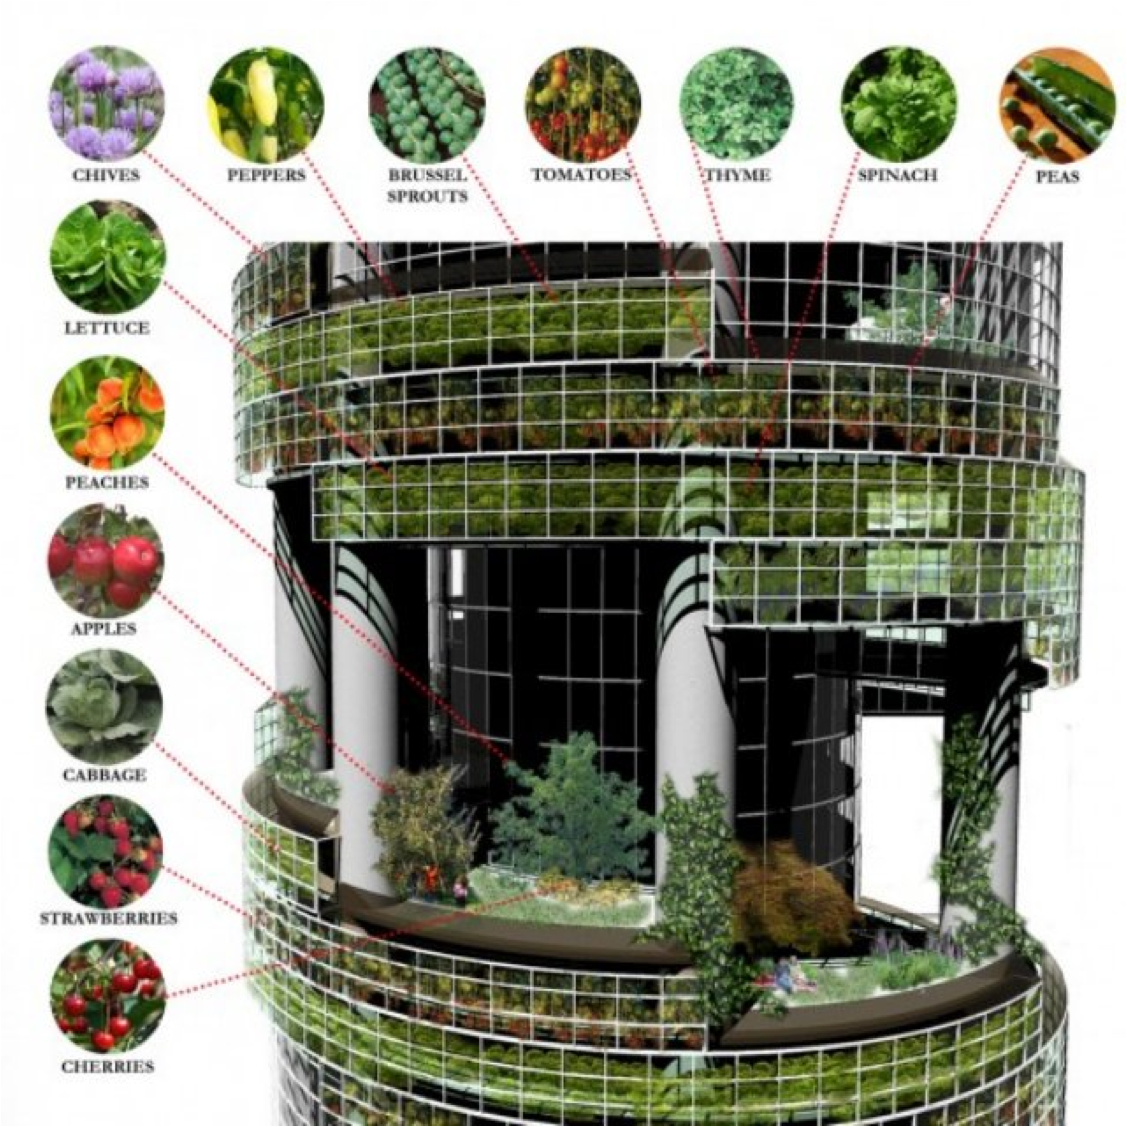
  • Explain biologically-inspired strategies for providing food sustainably
  • Explain how biologically-inspired design can increase energy efficiency and reduce costs

Resources:

Update 11/20/14 – check out this article about a new bus in the UK running on human waste!

Lesson Plan created by GK-12 Fellows Jakob Nalley and Sara Garnett, 2014

Apr 272014
 

butterfly

Human impacts on the environment are progressively altering ecosystems across the world. In this lesson we explore the dramatic effects of these human impacts on a well-known example, Monarch butterflies, and introduce realistic steps students can take to help address this problem. In the first part of this lesson students will play a game where they will learn the hazards facing Monarch butterflies on their annual migration from Mexico to the Midwest. In the middle of the lesson students will learn how to build a butterfly garden at their schools that will provide critical breeding resources to Monarchs as well as attract and support other butterfly species. We provide resources where you can find milkweed seeds to plant in your own garden. At the end of the lesson we provide a Butterfly Garden Bingo exercise to help students explore other plants and animals that can be found in established butterfly gardens. This exercise can be used with the BEST plots or in your own garden.

At the conclusion of the lesson, students will be able to:

  • Explain several reasons why milkweed populations in the United States are in decline and how this threatens Monarch butterfly populations
  • Explain why milkweed is an important resource for Monarchs
  • Construct a butterfly garden as a refuge for Monarchs and other butterflies
  • Identify other plants and animals in established butterfly gardens (or the BEST plots!).

Length of Lesson

Full lesson: 60 min class period

Monarch Migration Game only: 30 min

Butterfly Garden Bingo only: 20-30min

Grade Levels

Elementary

Resources:

Lesson created by Dustin Kincaid, Cara Krieg, and Susan Magnoli, 2014

Aug 152013
 

LakeIce

What evidence do scientists really have to support global climate change? Students will explore long term datasets on the duration of ice cover for three different lakes (Gull Lake, Fair Lake, and Lake Mendota). They will examine patterns of variation at different time scales to see the importance of long-term data as well as the importance of having multiple sources of support for scientific hypotheses (in this case, global climate change).

At the conclusion of the lesson, students will be able to:

  • Interpret data
  • Make inferences from trends or patterns in data
  • Make spatial and temporal comparisons of ecological systems
  • Explain how lake ice cover has changed due to global climate change on three lakes

Resources:

Lesson Plan created by GK-12 fellows Sara Parr Syswerda and Sigrid Smith, 2006

Jan 212013
 

pic2This lesson will explore how plant traits like seed dispersal (e.g., wind-dispersed, animal-dispersed, etc.), seed hardiness, and land-use history influence the assembly of weed communities following a major disturbance (e.g., construction of a BEST plot, agricultural field, or garden plot). The focus will be on volunteer species (read: weeds) most commonly found in the BEST plots across the network. The lesson begins by providing students background information on seed traits and land use legacies. After covering this information, participants will do a brief activity that involves making predictions about which plant traits make weeds made most successful. Students will spend the remaining portion of the lesson analyzing and interpreting volunteer species abundance data from the BEST plot network.

At the conclusion of the lesson, students will be able to:

  • List and describe four different plant dispersal mechanisms
  • Describe three determinants of “how a plant got there” (dispersal mechanism, seed bank longevity, effect of landscape)
  • Better interpret histograms and scatterplots

Resources:

Lesson Plan created by GK-12 Fellows Tyler Bassett, Dustin Kincaid, and Cara Krieg, 2012


Nov 072012
 

In this lesson, students learn about the difference between climate and weather and how we expect Michigan’s climate to change.  They use real data from the Kellogg Biological Station’s agricultural Long Term Ecological Research site to predict how specific crops may respond to climate change.

At the conclusion of the lesson, students will be able to:

  • Explain the difference between climate and weather
  • Name three ways the Michigan climate is expected to change
  • Show how some crops may improve with climate change while others decline

Resources:

Lesson written and created by GK-12 fellows Tomomi Suwa and Anne Royer, 2012

Nov 062012
 

The timing of recurring life cycle events for plants and animals, like flowering and migration, are largely determined by cues organisms take from the climate. Scientists who study phenology, or the timing of these natural events, are interested in how climate change, particularly rising global temperatures and unpredictable transitions between seasons, will influence the timing of phenological events. For example, what can we expect to happen to the migration timing of birds, the mating season for animals, or the flowering times in plants? Further, how might abiotic seasonal changes like melt dates for lakes and rivers respond to climate change? To answer these questions, scientists turn to long-term datasets to examine whether shifts in phenological events are occurring over extended periods of time.

Long-term datasets are extremely useful because scientists can examine average trends in timing shifts over periods of decades and often in different regions. Citizen science has played a major role in curating many of these datasets. Citizen science is essentially research conducted by “crowdsourcing” – individuals collect data and contribute to a large dataset that can then be analyzed to address scientific questions. Phenology data is easy to collect and involves observations that we make every day, but hardly ever record. Technology makes it extremely easy to record, aggregate, and store citizen science data online for future use.

In this lesson we will use a few of these datasets to go through the scientific process of forming and testing hypotheses using real data. Students will be able to examine changes in phenology over 30+ year timespans, and address the scientific question, “Do we see evidence for climate change in the phenology of plants and animals?” We will also discuss how students as a class can start curating their own long-term phenological datasets by observing organisms in your schoolyard or BEST Plots!

At the conclusion of the lesson, students will be able to:

  • Define phenology and give examples in plants and animals
  • Graph phenology data
  • Interpret results from a graph
  • Make claims about organismal responses to climate change
  • Identify locations where they can submit citizen science data they collect

Resources:

 Lesson plan written and created by GK-12 Fellows Liz Schultheis and Dustin Kincaid, 2012